


This Year's Thanksgiving Pie Preferences: Insights by Gender, Age, and Political Affiliation
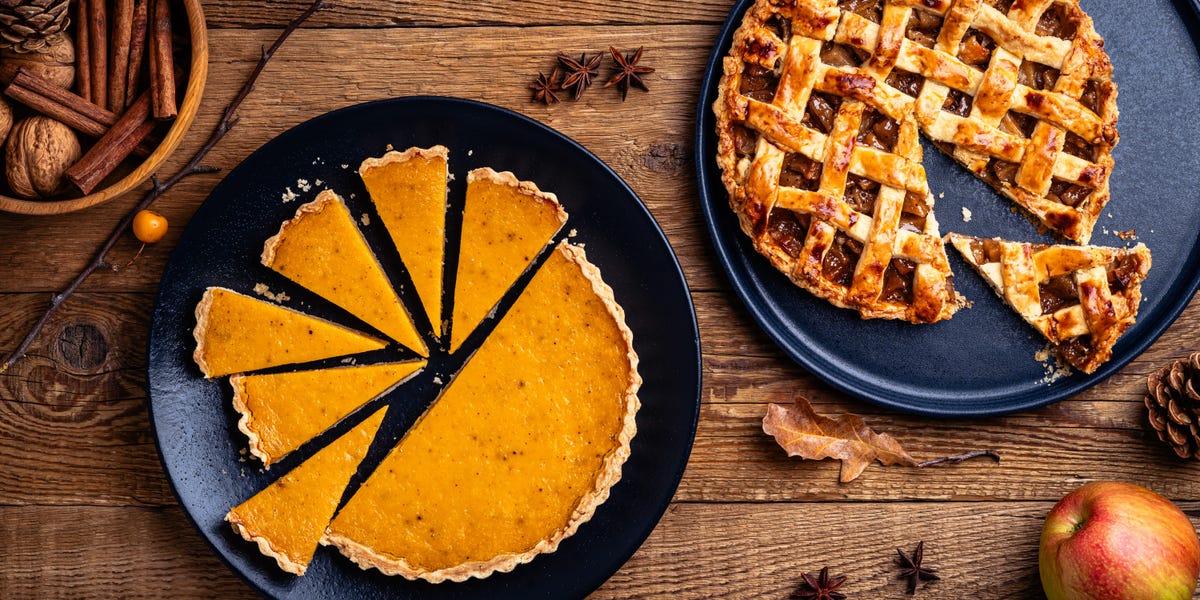
Pumpkin pie has emerged as the top contender in this year's battle of the pies.
Based on a survey conducted by YouGov on November 20, sampling 9,900 American adults, pumpkin pie received the most votes, capturing 29% of national preference.
Trailing behind, apple pie secured 20% of the votes, while smaller groups showed a penchant for pecan pie (14%), sweet potato pie (9%), and chocolate pie (9%).
Notably, 6% of those surveyed expressed their lack of interest in consuming pie during Thanksgiving. More for everyone else!
How Pie Preferences Vary Across Demographics
Gender appears to offer some clues on pie preferences for potential guests.
Approximately one-third of women (32%) labeled themselves pumpkin enthusiasts, while men were nearly split between selecting apple (24%) and pumpkin (26%).
Biological factors might explain these preferences. Studies indicate that around 35% of women in the U.S. are supertasters, compared to just 15% of men, potentially leading women to favor pumpkin pie's nuanced tastes, whereas many men opt for sweeter apple pies.
Youthful respondents lean more towards apple pie, with 29% of individuals aged 18 to 29 selecting it as their favorite.
As people age, an affinity for pumpkin pie seems to increase. It's uncertain whether this shift is due to tradition or changing taste buds. For the 30 to 44 age group, choices between pumpkin and apple are split evenly, whereas those aged 45 to 64 opt for pumpkin a third of the time, and 38% of those over 65 prefer pumpkin pie.
Pie and Politics: A Unique Comparison
Using pie preferences to gauge political leanings is largely ineffective.
Apple pie emerged equally popular amongst Democrats and Republicans, each accounting for 23%. Meanwhile, around 30% of all political stripes—Democrats (28%), Republicans (30%), and independents (30%)—expressed a preference for pumpkin pie.
A slight lean was noted for pecan pie, with 16% of Republicans selecting it over 12% of Democrats. Sweet potato pie also showed similar small variance: chosen by 12% of Democrats and 8% of Republicans.
More Common Than Pie: Post-Feast Shopping
Transcending any emotional debate about pie flavors, shopping after Thanksgiving ranks as a unifying activity. About half of those surveyed by YouGov plan to engage in some form of shopping in the week following their Thanksgiving meal.
Leave a Reply